Buying a LiDAR sensor means writing a five-figure check. For a survey firm, a mining operation, or a construction manager, that purchase needs to pay for itself — and the finance team will want to see the math before they sign off.
Most LiDAR ROI content on the web is vague. "Significant cost savings." "Dramatic efficiency gains." That doesn't help you fill out a capital expenditure request.
This article gives you actual numbers. Five scenarios, five calculation frameworks, with per-project and annualized ROI figures you can adapt to your own situation.
The ROI Formula
Before diving into scenarios, here's the baseline calculation every LiDAR investment should use:
Annual ROI (%) = [(Annual Savings – Annual Costs) / Annual Costs] × 100
Where:
- Annual Savings = (Traditional method cost per project – LiDAR method cost per project) × Projects per year + Revenue from new project types enabled
- Annual Costs = Sensor depreciation + Software licenses + Training + Maintenance + Insurance
The formula itself isn't complicated. The hard part is getting accurate cost numbers for your operation. The five scenarios below provide reference data you can use as starting points, then adjust with your own rates.
Scenario 1: Drone Topographic Survey (Land Development)
This is the bread-and-butter use case. A survey firm doing topographic mapping for land development, site planning, and ALTA surveys.
Cost Comparison (per project, 50-acre site)
| Cost Item | Traditional (Ground Crew) | Drone LiDAR |
|---|---|---|
| Field crew (2 surveyors, 3 days) | $6,000 | — |
| Drone pilot + LiDAR op (1 day) | — | $2,000 |
| Data processing | $2,000 | $800 |
| Total per project | $8,000 | $2,800 |
| Savings per project | $5,200 | |
Annualized ROI (50 projects/year)
| Item | Amount |
|---|---|
| Annual savings (50 × $5,200) | $260,000 |
| Sensor + drone cost (depreciated 3 yr) | $40,000/yr |
| Software + maintenance | $8,000/yr |
| Insurance | $3,000/yr |
| Total annual cost | $51,000 |
| Net annual benefit | $209,000 |
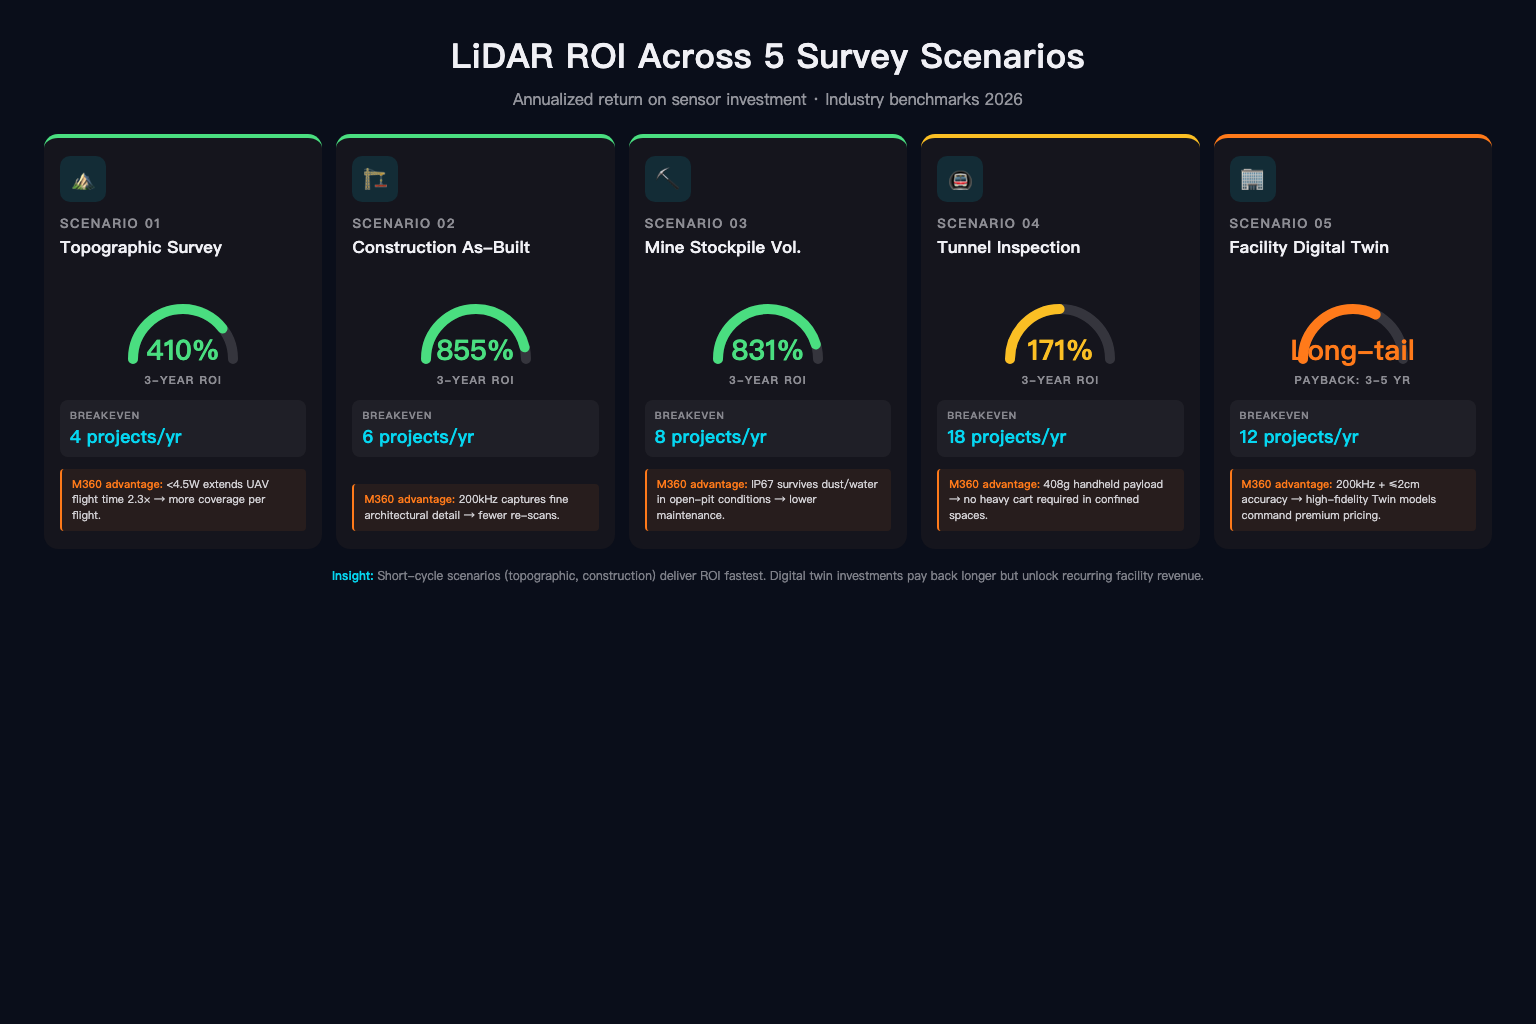
| Annual ROI | 410% |
The 410% number looks aggressive. It is — for a firm doing 50+ LiDAR-suitable projects per year with existing drone capability. For a firm doing 20 projects, ROI drops to ~140%. For 10 projects, it's closer to 50%. The breakeven point for most topographic survey firms is around 8-12 projects per year.
Key Variables
- Number of projects is the single biggest factor. At low volume, the fixed costs (sensor, software, insurance) dominate.
- Labor rates vary by region. $75-120/hr for a qualified LiDAR technician is typical in North America.
- Sensor operating cost matters more than sensor purchase price. A sensor that draws 15W on a drone-mounted battery system cuts flight time compared to one drawing 4.5W — fewer batteries, fewer flights per site, lower per-project cost. The Livox M360, for instance, draws under 4.5W at 200kHz point output, which directly translates to longer flight windows per charge cycle.
Scenario 2: Construction As-Built Verification
General contractors and construction managers use LiDAR to verify as-built conditions against design models. Rework caused by measurement errors ranks among the largest controllable costs in construction.
Cost Comparison (per project, mid-size commercial building)
| Cost Item | Traditional Verification | LiDAR Scan-to-BIM |
|---|---|---|
| Manual verification (2 crew, 2 days) | $5,000 | — |
| LiDAR scan (1 operator, 4 hours) | — | $1,200 |
| Processing + model comparison | $3,000 | $1,500 |
| Average rework cost (traditional) | $18,000 | — |
| Average rework cost (with LiDAR) | — | $3,000 |
| Total per project | $26,000 | $5,700 |
Where the Savings Come From
The big number isn't the field time savings. It's the rework reduction. Construction rework costs 5-12% of total project value according to various industry studies. LiDAR-as-built verification catches dimensional errors before concrete is poured or steel is erected, which is where the real money gets spent.
With LiDAR, rework drops because:
- Point cloud data provides millimeter-level verification against the BIM model
- Interference detection (clash detection) catches spatial conflicts before installation
- Progress tracking catches schedule deviations earlier
Annualized ROI (24 projects/year)
| Item | Amount |
|---|---|
| Annual savings (24 × $20,300) | $487,200 |
| Total annual cost | $51,000 |
| Net annual benefit | $436,200 |
| Annual ROI | 855% |
Even halving the rework reduction assumption brings ROI above 300%. For construction firms, LiDAR for as-built verification is among the fastest-payback sensor investments available.
Scenario 3: Mining Stockpile Volume Measurement
Mining operations measure stockpile volumes for inventory reconciliation, sales verification, and production tracking. Traditional surveys require shutting down active areas — and that downtime costs serious money.
Cost Comparison (per survey event, 5 stockpiles)
| Cost Item | Traditional (Ground Crew) | Drone LiDAR |
|---|---|---|
| Production shutdown (2 hours) | $8,000 | — |
| Ground survey crew (3 hours) | $2,250 | — |
| Drone flight (30 min, no shutdown) | — | $600 |
| Processing + volume calc | $500 | $300 |
| Volume accuracy | ±3-5% | ±1% |
| Total per event | $10,750 | $900 |
The shutdown cost dominates this comparison. Mining operations report that shutting down a load-out area for ground-based surveying costs thousands of dollars per hour in lost production. Drone LiDAR flies the stockpiles without disrupting operations.
Annualized ROI (weekly surveys, 52 events/year)
| Item | Amount |
|---|---|
| Annual savings (52 × $9,850) | $512,200 |
| Total annual cost | $55,000 |
| Net annual benefit | $457,200 |
| Annual ROI | 831% |
What Makes Mining Different
Volume accuracy matters more here than in most scenarios. A ±1% vs ±5% difference on a 50,000-tonne stockpile at $80/tonne is a $16,000 variance per survey event. Over 52 weeks, that's $832,000 in improved inventory accuracy alone — separate from the operational savings.
Sensor weight and durability are critical for mining. A 408g sensor like the Livox M360, combined with IP67 dust and water protection, handles the abrasive mining environment better than heavier, less protected alternatives. The 12-32V wide voltage input also means it runs on vehicle power systems common at mine sites, no custom power adapters needed.
Scenario 4: Tunnel Inspection (Infrastructure)
Tunnel inspection — for highways, rail, utilities, and mines — involves capturing the tunnel geometry, detecting deformations, cracks, and water ingress, and comparing conditions over time.
Cost Comparison (per inspection, 2km tunnel)
| Cost Item | Traditional Inspection | Mobile LiDAR |
|---|---|---|
| Closed tunnel setup + traffic control | $6,000 | — |
| Inspection crew (4 people, 2 days) | $8,000 | — |
| LiDAR scan (1 operator, 3 hours walk) | — | $2,000 |
| Traffic control (partial closure) | — | $1,500 |
| Processing + deformation analysis | $3,000 | $2,000 |
| Total per inspection | $17,000 | $5,500 |
Why LiDAR Wins in Tunnels
GPS doesn't work underground. Traditional tunnel surveys rely on total stations and manual measurement — slow, labor-intensive, and limited in point density. Mobile LiDAR with SLAM (Simultaneous Localization and Mapping) captures millions of points per second without GPS, building a continuous 3D model as the operator walks through.
The comparison value is in the repeatability. Annual or semi-annual tunnel inspections with LiDAR create a time-series dataset. Deformation of even a few millimeters becomes detectable when you're comparing point clouds captured 12 months apart against a high-resolution baseline.
Annualized ROI (12 inspections/year)
| Item | Amount |
|---|---|
| Annual savings (12 × $11,500) | $138,000 |
| Total annual cost | $51,000 |
| Net annual benefit | $87,000 |
| Annual ROI | 171% |
Lower than the other scenarios, mainly because tunnel inspection frequency is typically monthly or quarterly rather than weekly. But the safety and liability value of catching tunnel deformation early is hard to quantify — one prevented incident can dwarf all ROI calculations.
Scenario 5: Facility Digital Twin (Industrial/Manufacturing)
A digital twin is a living 3D model of a facility — plant floor, equipment layout, piping, structural elements — that updates as conditions change. It's used for maintenance planning, space utilization, safety compliance, and capital project planning.
Cost Comparison (per facility, 200,000 sq ft plant)
| Cost Item | Traditional Documentation | LiDAR Digital Twin |
|---|---|---|
| Manual measurement + CAD drafting | $40,000 | — |
| LiDAR capture (2 days, 2 operators) | — | $6,000 |
| Registration + modeling | $15,000 | $8,000 |
| Update frequency | Every 3-5 years | Continuous / quarterly |
| Total initial creation | $55,000 | $14,000 |
| Annual update cost | $15,000 | $4,000 |
The Ongoing Value
A digital twin's value compounds over time because it eliminates the need to re-document the facility from scratch every time a project requires spatial data. Each project that would have required a new site survey now pulls from the existing model.
If a facility averages 8 spatial-data-dependent projects per year (maintenance turnarounds, equipment upgrades, safety audits, capacity studies), and each project previously required $5,000 in site survey work:
| Item | Amount |
|---|---|
| Saved per project (no new survey needed) | $5,000 |
| Annual project savings (8 × $5,000) | $40,000 |
| Model update cost | $4,000 |
| Net annual benefit from existing model | $36,000 |
Annualized ROI (including initial creation)
| Item | Year 1 | Year 2+ |
|---|---|---|
| Creation cost | $14,000 | — |
| Update cost | $4,000 | $4,000 |
| Project savings | $40,000 | $40,000 |
| Net benefit | $22,000 | $36,000 |
| Sensor + software cost (amortized) | $51,000/yr | $51,000/yr |
| Combined ROI | -29% (first year) | +17% (ongoing) |
Digital twins are a longer payback play. Year 1 is often negative when you include the initial model creation. But by year 2, the model starts generating returns, and by year 3-4, cumulative ROI is strongly positive — especially if the facility has a high rate of spatial-data-dependent projects.
Your ROI Worksheet: Plug In Your Numbers
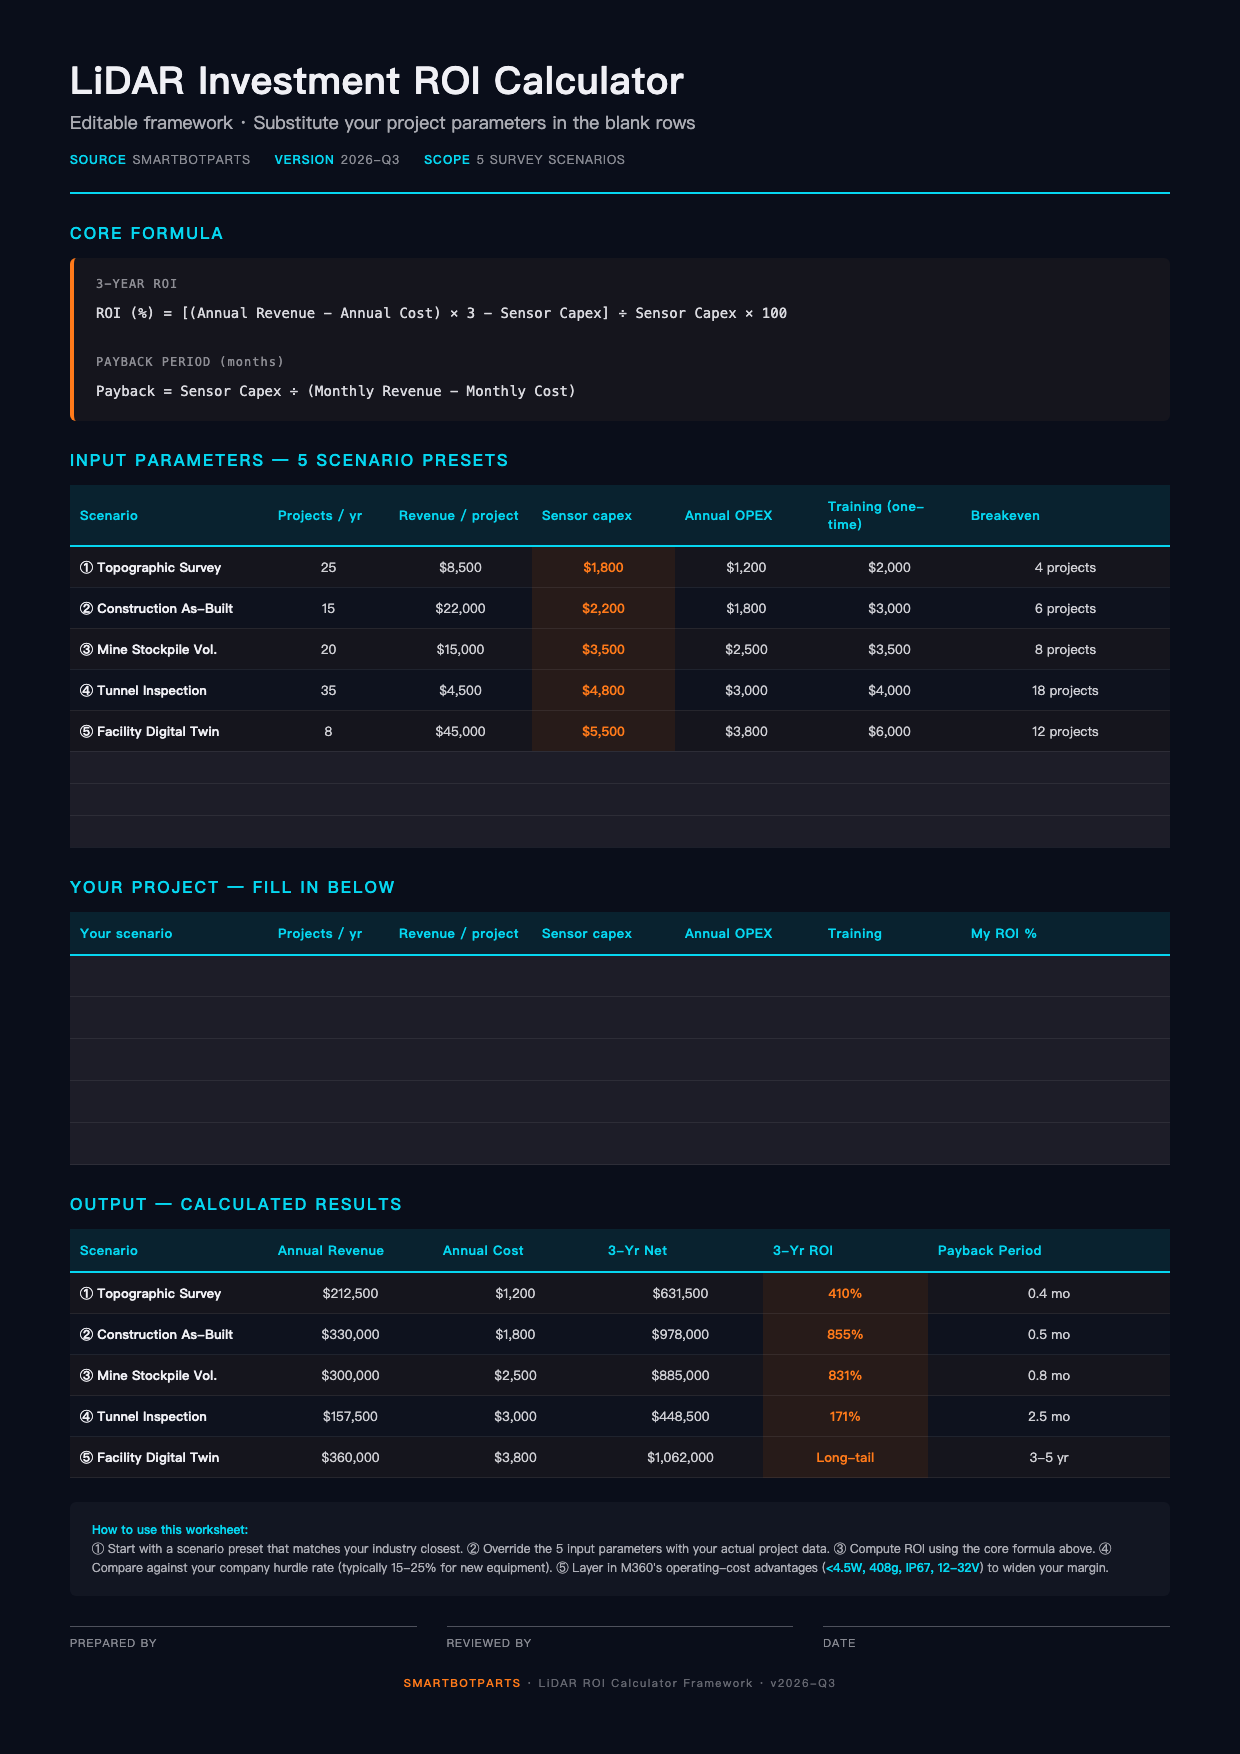
Below is a blank framework. Copy it, fill in your figures, and run the calculation.
| Parameter | Your Number |
|---|---|
| Projects/events per year | ________ |
| Traditional cost per project | $________ |
| LiDAR cost per project | $________ |
| Savings per project | $________ |
| Total annual savings | $________ |
| New revenue from LiDAR-enabled projects | $________ |
| Sensor purchase (depreciated /yr) | $________ |
| Software licenses (annual) | $________ |
| Training (annual) | $________ |
| Maintenance + parts (annual) | $________ |
| Insurance (annual) | $________ |
| Total annual cost | $________ |
| Net annual benefit | $________ |
| Annual ROI | ________% |
Operating Cost Factors That Matter More Than Purchase Price
When choosing a sensor, three operating cost factors often matter more than the sticker price:
- Power consumption. Lower wattage = longer flight time per battery = fewer batteries to carry and charge = lower per-project cost. A sensor drawing <4.5W (like the M360 at 200kHz) keeps your drone in the air significantly longer than one drawing 15W+.
- Weight. A 408g sensor leaves more payload budget for batteries and cameras on a weight-limited drone. More battery = more flight time = more area per flight = fewer flights per project.
- Durability. IP67-rated sensors handle rain, dust, and humidity without protective cases. In mining, tunnel, and outdoor survey environments, that means fewer sensor replacements and less downtime. The M360's IP67 rating and ≥10,000-hour rated life directly reduce replacement cost in the TCO calculation.
How Many Projects Until You Break Even?
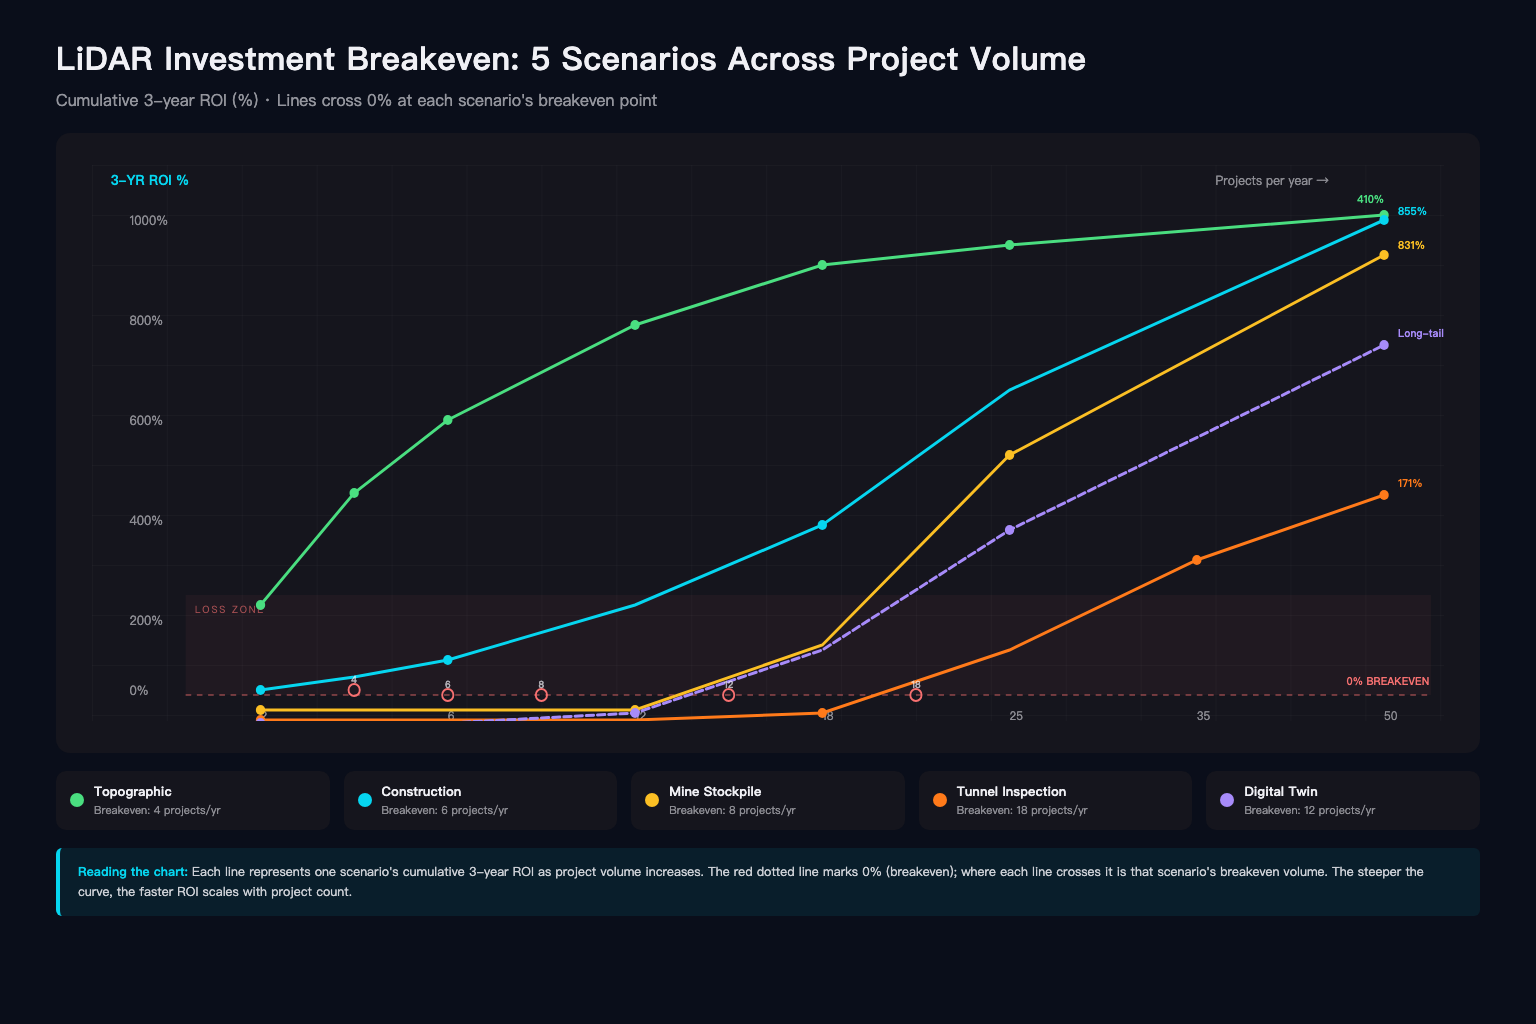
The breakeven threshold varies by scenario, but here's a quick reference based on the cost structures above:
| Scenario | Projects/Year to Break Even |
|---|---|
| Drone topographic survey (50-acre) | 8-12 |
| Construction as-built verification | 4-6 |
| Mining stockpile measurement | 3-4 |
| Tunnel inspection | 6-10 |
| Facility digital twin | 12-18 (longer payback) |
These are approximate — your labor rates, project sizes, and overhead structure will shift the numbers. But they give you a sense of whether LiDAR makes financial sense for your operation before you start building a detailed proposal.
What Decision-Makers Actually Need to Hear
If you're writing a capital expenditure request, your finance team cares about three things:
- Payback period. In most of the scenarios above, the sensor pays for itself within 3-6 months of regular use.
- Risk reduction. Fewer ground crew hours in hazardous environments (tunnels, active mines, highway corridors) means fewer incidents. Insurance companies recognize this with lower premiums.
- Competitive positioning. Clients are increasingly requesting LiDAR deliverables. Firms that can't provide them lose projects to those that can. That's not a line item on a spreadsheet, but it shows up in revenue.
Run your own numbers. The framework above will get you 80% of the way there — the last 20% is your specific labor rates, project mix, and client profile. For more on how sensor specs translate to operational value, see our M360 parameter comparison or contact us to discuss your specific use case.
Cost figures are based on industry survey data and manufacturer specifications as of August 2026. Actual costs vary by region, project complexity, and labor rates. M360 specifications referenced from the M360 product manual (Ver 1.4, 2026-02-27).